Tips on Profile
先说几个小坑点:
默认情况下,Golang Profile 取样的频率为 100Hz,意味着每 10ms 才会取样一次,所以程序运行时间少于 10ms 肯定不会被取样
但是我们可以通过 runtime.SetCPUProfileRate() 重新设置值,重新进行调试,比如将采样率设置为 1000,每 1ms 就会取样一次,但是这样对性能的开销很大,Golang 官方建议这个值不要设置在 200 以上
其实最好的还是让程序多运行一段时间,比如 1s 左右,个人测试即使将采样率调高,如果一个程序只运行 10ms 左右,采样的结果也大概率为空
在正确位置设置上述语句后,程序提示 “runtime: cannot set cpu profile rate until previous profile has finished.",这句错误提示简直不明不白的,我第一次看到这个错误提示还以为就是字面意思:系统中可能存在正在运行的 profile 程序
查资料后发现,runtime.SetCPUProfileRate() 是一种比较 Hack 的做法,所以该错误提示可以忽略
在程序运行时,直接通过 kill 命令结束程序的话,最后生成的 profile 为空(?),最好使用下面的这个模式:
 sigs := make(chan os.Signal, 1)
 signal.Notify(sigs, syscall.SIGINT, syscall.SIGTERM)

 server := NewServer(port, connMap)
 go server.Run()

 <-sigs
 Log.Info("Shutting down server")
- 通过
signal.Notify来拦截 kill 的信号,保证程序能够正常结束,profile文件不为空
How to Profile
if pprofFlag {
 // runtime.SetCPUProfileRate(1000)

 cpuFile, err := os.Create("executor_profile.prof")
    if err != nil {
        fmt.Println("无法创建 CPU profile 文件:", err)
        return
    }
    defer cpuFile.Close()

    // 开始 CPU profile
    if err := pprof.StartCPUProfile(cpuFile); err != nil {
        fmt.Println("无法启动 CPU profile:", err)
        return
    }
    defer pprof.StopCPUProfile()
}
- 注意这段代码只能放在 main 函数中,否则
defer语句的语义会有影响
How to Read Profile Results
命令行
(pprof)  top 10
Showing nodes accounting for 40ms, 100% of 40ms total
Showing top 10 nodes out of 26
      flat  flat%   sum%        cum   cum%
      10ms 25.00% 25.00%       10ms 25.00%  os.(*File).checkValid (inline)
      10ms 25.00% 50.00%       10ms 25.00%  runtime.(*mheap).allocSpan
      10ms 25.00% 75.00%       10ms 25.00%  runtime.(*profBuf).read
      10ms 25.00%   100%       10ms 25.00%  runtime.startm
         0     0%   100%       10ms 25.00%  log.(*Logger).Output
         0     0%   100%       10ms 25.00%  log.Println
         0     0%   100%       10ms 25.00%  main.main.func1
         0     0%   100%       10ms 25.00%  os.(*File).Write
         0     0%   100%       10ms 25.00%  runtime.(*mcache).nextFree
         0     0%   100%       10ms 25.00%  runtime.(*mcache).refill
flat:该函数本身直接消耗的时间。比如,flat = 10ms 表示这个函数自身消耗了 10 毫秒的 CPU 时间,而不是它调用的其他函数所消耗的时间。
flat%:该函数消耗的时间占总 CPU 时间的百分比。比如,flat% = 25.00% 表示该函数消耗了总时间的 25%。
sum%:累积的百分比,表示从报告的顶部开始累加至当前行函数的总百分比。这个数值会递增到 100%。比如,如果一个函数消耗了 25%,再加上下一个函数消耗的 25%,它们的 sum% 将是 50%。
cum:累积时间,表示该函数及其所有调用链中的函数总共消耗的时间。比如,cum = 10ms 表示当前函数以及它调用的所有函数总共消耗了 10 毫秒的 CPU 时间。
cum%:累积的时间占总时间的百分比。这个值通常表示从上到下的累积时间百分比。
os.(*File).checkValid函数本身消耗了 10ms,占总时间的 25% (flat%),累积百分比为 25% (sum%),该函数及其所有调用的函数总共也消耗了 10ms (cum)。runtime.(*mheap).allocSpan本身也消耗了 10ms,占总时间的 25%,累积百分比是 50%。
sum%相当于是前缀和
flat and cum
假设有以下函数调用关系:
main() --> A() --> B() --> D()
           |
           --> C()
各个函数的执行时间如下:
- main():
- flat 时间:10ms
- A():
- flat 时间:5ms
- B():
- flat 时间:15ms
- C():
- flat 时间:20ms
- D():
- flat 时间:50ms
计算累积时间
- D() 函数
- cum 时间 = 自身 flat 时间 + 被调用函数的 cum 时间
- D() 不调用其他函数
- cum 时间 = 50ms
- B() 函数
- 调用 D()
- cum 时间 = 自身 flat 时间(15ms) + D() 的 cum 时间(50ms) = 65ms
- C() 函数
- 不调用其他函数
- cum 时间 = 20ms
- A() 函数
- 调用 B() 和 C()
- cum 时间 = 自身 flat 时间(5ms) + B() 的 cum 时间(65ms) + C() 的 cum 时间(20ms) = 90ms
- main() 函数
- 调用 A()
- cum 时间 = 自身 flat 时间(10ms) + A() 的 cum 时间(90ms) = 100ms
结果总结
| 函数名 | flat 时间 | cum 时间 |
|---|---|---|
| D() | 50ms | 50ms |
| B() | 15ms | 65ms |
| C() | 20ms | 20ms |
| A() | 5ms | 90ms |
| main() | 10ms | 100ms |
Web UI
使用 Web UI 比较方便:
go tool pprof -http localhost:8080 profile.prof
我们要先理解 profile 中的两个重要指标:
每个位置(函数或代码段)包含两个值:
- flat(平值):表示该位置本身消耗的资源或时间。
- cum(累积值):表示该位置本身及其所有子位置(即调用链中该位置下的所有函数或代码段)的资源或时间总和。
假设有三个函数:A 调用了 B,而 B 调用了 C。
- C 自身运行时间是 5ms(flat=5ms),没有调用其他函数,所以它的累积值也是 5ms(cum=5ms)。
- B 自身消耗了 3ms(flat=3ms),但因为它还调用了 C,所以它的累积值是 3ms + 5ms = 8ms(cum=8ms)。
- A 自身消耗了 2ms(flat=2ms),它调用了 B,所以它的累积值是 2ms + 8ms = 10ms(cum=10ms)。 这样,通过 pprof 可以看到每个函数自身的消耗(flat),以及它们总的资源占用情况(cum),帮助找出性能瓶颈。
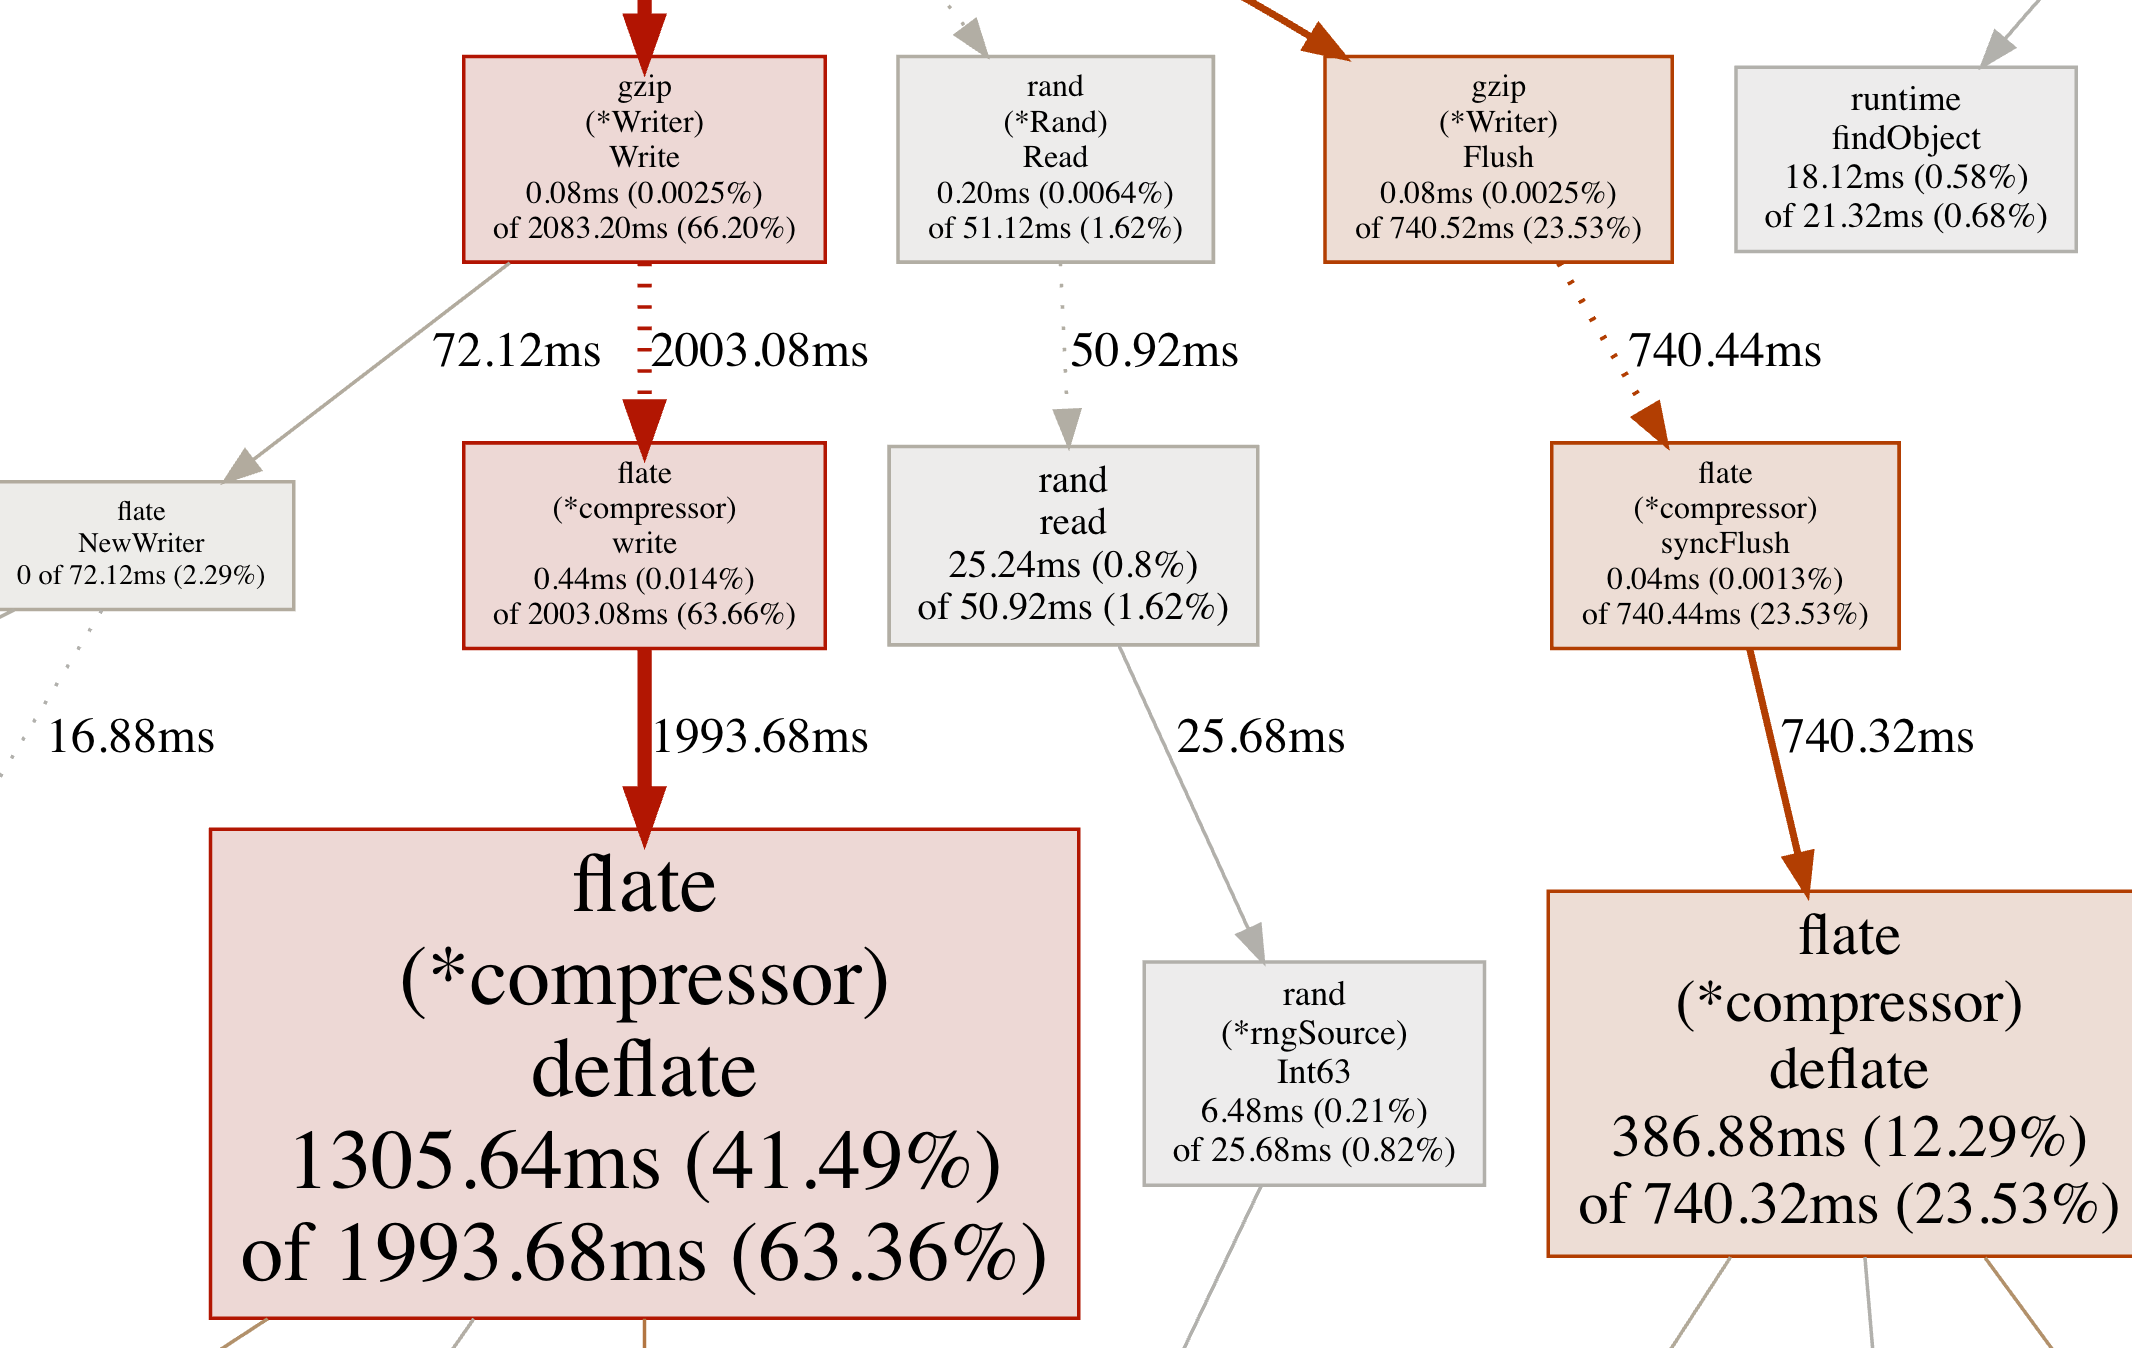
最重要的是如何解读 callgraph
Node Color:
- large positive cum values are red.
- large negative cum values are green(negative values are most likely to appear during profile comparison)
- cum values close to zero are grey.
Node Font Size:
- larger font size means larger absolute flat values.
- smaller font size means smaller absolute flat values.
Edge Weight:
- thicker edges indicate more resources were used along that path.
- thinner edges indicate fewer resources were used along that path.
Edge Color:
- large positive values are red.
- large negative values are green.
- values close to zero are grey.
Dashed Edges: some locations between the two connected locations were removed.
Solid Edges: one location directly calls the other.
假设有一个调用链:A -> B -> C,并且生成的调用图显示如下:
- A 节点是红色且字体很大,表明 A 本身消耗了大量资源,且 A 调用链下的所有函数累积消耗也很大。
- B 节点是灰色,表示它及其子函数消耗的资源较少,且字体较小,表明 B 本身的资源消耗较少。
- A -> B 的边缘是粗的红色线,表示 A 调用 B 时消耗了大量资源。
- B -> C 的边缘是细的灰色线,表示 B 调用 C 的消耗几乎可以忽略。
Edge Weight 是指两个节点之间资源或时间消耗的程度。具体来说,边缘权重表示从一个节点(函数)到另一个节点(函数)沿着这条路径消耗的资源或时间量。
- 粗边:表示两个节点之间的调用路径消耗了较多的资源或时间。
- 细边:表示两个节点之间的调用路径消耗较少。
假设调用链为 A -> B -> C -> D -> E 在 pprof 的调用图中,可能会简化为 A -> E Edge Weight 衡量的是 BCD 的消耗
Duration: 4.15s, Total samples = 36.24s(872.85%)
- 性能分析的 实际运行时间 为 4.15 秒。换句话说,程序运行了 4.15 秒。
- 采样总时间 是 36.24 秒。这是分析中从多个线程或核心收集到的 CPU 时间总和。
- 872.85% 表示这个采样时间远远超过了实际运行时间(4.15 秒),通常是因为程序在多个 CPU 核心上并发运行,因此累积的 CPU 时间大于实际运行时间。
比如下面的这个实际例子

举例:flate (*compressor) deflate 1305.64ms (41.49%) of 1993.68ms (63.36%)
- 1305.64ms - 累积时间 (cum) 这是当前函数及其所有调用的函数总共花费的时间。在这个例子中,flate (*compressor) deflate 函数本身以及它调用的所有子函数一起总共消耗了 1305.64 毫秒。 也就是说,在 flate (*compressor) deflate 内部及它的子调用中,总共占用了 1305.64ms 的 CPU 时间。
- (41.49%) - 占程序总时间的比例 这个百分比表示这个函数及其调用链所花费的时间在整个程序执行中的占比。在这个例子中,flate (*compressor) deflate 及其调用的子函数占了程序总执行时间的 41.49%。 这意味着:在整个程序运行期间,约有 41.49% 的时间是在执行 flate (*compressor) deflate 及其子调用的相关操作。
- of 1993.68ms - 上级函数的累积时间 1993.68ms 表示调用当前函数的上级函数(或调用链的上层)总共花费的累积时间。在这个例子中,flate (*compressor) deflate 的上级函数消耗了 1993.68 毫秒。 换句话说,flate (*compressor) deflate 函数的调用链(包括它的上级和所有子级函数)一共占用了 1993.68ms。
- (63.36%) - 上级函数在程序总时间中的占比 这个百分比表示当前函数所在的调用链(包含它的上级函数)所占用的程序总时间比例。在这个例子中,调用 flate (*compressor) deflate 的上级函数及其调用链占了程序总执行时间的 63.36%。 也就是说,从 flate (*compressor) deflate 及其上级函数开始的调用链,占用了程序总执行时间的 63.36%。
这意味着在 1993.68ms 的调用链时间中,该函数占了 1305.64ms,相当于 41.49% 的 CPU 时间,而这个调用链又占了整个程序的 63.36%
每个方框中的数据表示以下几点:
- 当前函数消耗的时间(包括子函数),如 1305.64ms。
- 当前函数消耗的总时间占整个程序执行时间的比例,如 41.49%。
- 调用当前函数的上级函数及其整个调用链所消耗的总时间,如 1993.68ms。
- 上级函数调用链占整个程序执行时间的比例,如 63.36%。
Practice
https://nyadgar.com/posts/go-profiling-like-a-pro/ 对整个 Profile 的过程进行了实战,讲得很清楚,可以参考